#Post Title #Post Title #Post Title

Is This a Bear Trap or a Secondary Top ?

Nifty update : 29-10-2013

1.On 24-10-2013 we have seen Pinocchio bar which is a sign of exhaustion .
2.On 23-10-2013 we had also seen hanging man , which is an alert for trend reversal .
3.on 28-10-2013 according to us we had confirmation for hanging man as we have seen nifty closing below 6103.
4. Now we can use 6260 as closing stop loss for risky trader and intraday sl for safe trader for the tgt of 6055-5950-5880 -5745.
5.For 30-10-2013 6247 resistance 6199 support
[ Read More ]

BEARISH PINOCCHIO Bar

                     Nifty update 24-10-2013


1.We saw BEARISH PINOCCHIO on nifty , it means Price pushed decisively above the previous high on an intraday bar  basis but closed below it — a sign of exhaustion.
2.Yesterday we had hanging man ,(a trend reversal pattern).
3.Nifty  is indicating good sign of weakness .
4. But we recommend to wait for confirmation to go positional short ie. below 6103 (closing basis).
5.Below that we may see much deeper correction.
6.6247 is resistance 6119 is support (spot level)
[ Read More ]

Hanging Man on daily time Frame

                   Nifty update 23-10-2013


1.Hanging man on daily time frame indicating bulls loosing control.(Further  confirmation  is required)
2.Second evidence was lower HIGH - lower Low formation started and close below  two days average .
3.RSI near previous resistance area , indication of correction.
4.Nifty closed above channel , so for  further  correction it has to  beak todays low and close below lower channel line .
5. so positional sell only if we break 6103 and close at or below 6103
6. 6199 is resistance and 6119 is support
[ Read More ]

Aptech

Buy Aptech if  close above 73 sl 67.50 tgt 80-89-95

note :- chart will be update after market hour
[ Read More ]

Yes this is now the right time to book profit and Cautious zone for Bulls

                       Nifty update 


1. Today it was clear that bulls were loosing their control on momentum.
2.After a doji close on 21-10-2013 , they was no strong follow up session by bulls .
3. Supply  was witnessed at 6210-6215 level.
4.On Daily chart we can see negative  divergence  on ADX , it means we may see change in trend , but not yet confirmed .
5. We can also see  raising   wedged  sentiment formation , result may be an impulse fall .
6. Gap down action is quite  needed  at this stage .
7.We can also see   spinning   top formation , which gives the message of weak momentum .
8 6231 may act as resistance and 6166 a crucial support zone
[ Read More ]

Nifty update (spot level ) 21 October 2013

      Nifty update (spot level ) 21 October 2013 


1.Nifty had a close of 6204 which is one of the best close from 2010.
2.Thought it  hasn't given any sell signal yet , but some patterns make us to take back seat at this stage .
3.We can see broadening top formation on 60 min with negative RSI divergence .
4. Doji close on daily , making us to think why bulls got tired even though nifty was sustaining above 6170.
5.Doji does not mean to sell , it is just an early signal to get alert .
6. On 22 October we need to see who takes in charge bulls or bears , in case of bear they need to hold market below 6150 till 10.55 am, and in case of bull, they need to protect 6150 till 10.45 am.
7.Nifty may face resistance at 6231 and support  at 6150


[ Read More ]

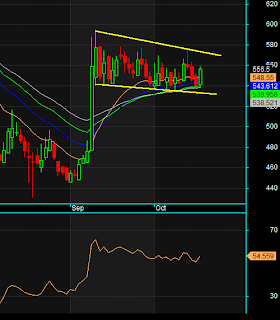
Flag Pattern on ABB

ABB ON MULTIPLE SUPPORT AT 537 LEVEL

1. We can see flag pattern on ABB 
2. Multiple support at 537 level
3.Rsiky tader can buy at CMP (556) or above 574 with the sl of 530 closing basis for the target of 594-628-645 .( two to three week)
[ Read More ]

Trading opportunity for the week (21 oct 2013 - 25 oct 2013)

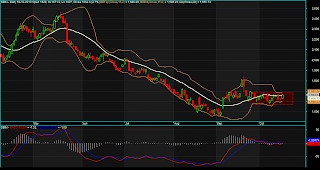
Volatility squeeze on Sbi & MACD on the way to give positive breakout


1.Sbi an  under performer  candidate now  roaring  to perform .
2.We can see bollingerband  squeeze on daily time frame
3.Now it time for MACD to turn positive if sbi gives break out of its consolidation range(close above 1702)(highlighted  on chart).
4.Morning star pattern on daily time frame
5.so one can buy sbi with the sl of 1609 tgt 1684 -1702-1712-1728. Sell only below 1598 sl 1615 tgt 1534.
[ Read More ]

Are we into a new bull market or in the matured Uptrend?


What must be our strategy at this juncture, we have seen in the past market has given a decent correction from the current level i.e. 6100-6250.

What's making us worry ,is the technical indicators .
1.On 60 min time frame , we can see negative divergence
2. ADX too on the daily time frame shows negative divergence
3. Bollinger band on daily , weekly and monthly time frame is showing a resistance at 6275 area
4. MACD histogram indicating divergence
5. BUT we have seen broader market participant and good Volumes too.


So it is an indecision stage for positional trader and Investor to take a call on the market.
We have also seen that there is a lack of retail market participation and we have liquidity driven rally .

A clear picture of breakout is possible if we give monthly close above 6375 and we can see correction if we break 6065 on closing basis.
Till then every dip is buying opportunity in this market

So for this week ( spot level )

Range for nifty 6275- 5961
1. So below 6175 we can see the correction till 6139-6131 , as now 6129.35 is important low below which 6095 

2. If we get a correction till 6095 , then buy nifty with sl of 6066 tgt 6135-6187-6222

3. We can see sell off only below 6015 on closing basis , in that case sell below 6015 sl 6070 tgt  5963- 5914-5880-5864

4. One can also buy above 6139 sl 6117 tgt 6187-6222

Stocks for this week (spot level)

1.  Range for sbi 1574-1734
Buy sbi with the sl of 1609 tgt 1684 -1702-1712-1728. Sell only below 1598 sl 1615 tgt 1534

2.  Range for yes bank  305-380
Buy yes bank with the sl of 319 tgt 354-375-387

3. Range for Maruti  1395- 1549
Buy on dip till 1420 with the sl of 1392 for tgt  of 1501-1525

4. Range for ABB 532-593
Buy  ABB with the sl of 532 tgt 577-593
[ Read More ]

Nifty Update

                                                             NIFTY UPDATE


1.Yesterday we recommended to hold short with sl of 6095 .(After market analysis )

2.Today we have open = low on daily time frame which indicates bullishness at least for that day or till it get brake , and we witnessed the same ie . today's low 6070.90 was protected through out the day .
3. above 6095 there was triangle break out on 60 min time frame and confirmation of double bottom on RSI 60 min time frame
4. At 6150 we again recommend to sell with sl of 6160 , which also got triggered
5. Now we can see negative divergence is developing on 60 min time frame with contracting bias , indication of correction .
6 . So below 6175 we can see correction till 6139-6131 , as now 6129.35 is important low below which 6095 is possible .
[ Read More ]

spinning top


1.at 6095 spot level our stoploss got trigerred 
2. Now at 6142  again we observed spinning  top on nifty  on 15 min time frame which is indicating that bull may loose control .
3. Again creating selling  opportunity with strict sl of 6160 tgt  6095

[ Read More ]

WILL IT BREAK CHANNEL OR AGAIN A SHORTING CANDIDATE


1. On daily chart we can see that ACC is facing resistance of bearish trend line or downward sloping channel
2. Even RSI is on resistance zone
3. On 15-10-2013 there was Counter attack  Candle stick on daily chart
4.Today ie on 17-10-2013 there is indecision candle with low volume and open interest
5. one can take a short position if it break 1106 and  will be good shorting candidate it close below 1106 on weekly basis
6. So sell it with 1174 as  sl and tgt 1076-1040 time horizon short term (7-15 days)


[ Read More ]

TRADING STRATEGY FOR 18-10-2013

                             TRADING STRATEGY   FOR 18-10-2013


1. We can see lower highs and lower lows on nifty as well as on RSI
2. We have drawn Bearish resistance on Nifty as well as on RSI.
3.Now nifty may face resistance at 6095-6080 area and lower targets are open at 6000-5980
4.But Fast Drift  seem little Difficult as we can see there is reduction in premium , which indicates shorts are added , and when major consequences are same (short ) it take time to hit on lower side . or we may see Gap Down Action.
5.We Are holding our lower side Target for 6000-5980 , one may use 6095 as stoploss


[ Read More ]

NIFTY UPDATE

NIFTY UPDATE (SPOT LEVEL)

1.ON 15-10-2013 , we did mentioned about weakness on daily time frame.
2. Today we witnessed the same
3.We saw how one can take the opportunity by drawing trend line on RSI
4. And the power of candle stick (spinning top ) on 60 min time frame
5.Our first target of 6040 was achieved


note :- to learn more on candlestick pattern , indicators  join our Basic module

to see previous post click :-  http://www.bewithtrend.com/2013/10/nifty-update-spot-level.html


[ Read More ]

TATA CHEMICAL

WILL IT BE INVESTORS FAVORITE ???

1. IF any one looking for fixed returns kind of investment in equity market one can think of Tata chemicals
2. Technically it may go in to consolidation range ie from 250- 215 and once it gives break out it may appreciate by 30-50% 2 year horizon or sooner .
3.A small insight on fundamental :-


Market Cap: Rs. 6232.41 Crores
Current Price: Rs. 244.60
Book Value: Rs. 254.66
Stock P/E: 16.93
Dividend Yield: 4.09%
Stock is Rs. 10.00 paid up


52 Week High/Low: Rs. 381.50 / Rs. 234.50
PB X PE: 16.25
Graham Number: Rs. 287.64
Price to book value: 0.96
Price to Earning: 16.93
Profit growth 5Years: 26.95%
OPM 5Year: 15.78%
Operating profit: Rs. 2079.63Cr.
G Factor: 1.00
Piotroski score: 5.00
Earnings yield: 17.35%
EPS: Rs. 14.44


Pros:
- Stock is providing a good dividend yield of 4.09%.
- Stock is trading at 0.96 times its book value
- Company has been maintaining a healthy dividend payout of 40.41%

Cons:
- Promoter holding is low: 31.06%
- Company has a low return on equity of 10.98% for last 3 years.
- Company might be capitalizing the interest cost

 note:- fundamental taken from different web source

Market Cap: Rs. 6232.41 Crores
Current Price: Rs. 244.60
Book Value: Rs. 254.66
Stock P/E: 16.93
Dividend Yield: 4.09%
Stock is Rs. 10.00 paid up
Listed on BSE & NSE
52 Week High/Low: Rs. 381.50 / Rs. 234.50

Quick Ratios Lookup:

PB X PE: 16.25
Graham Number: Rs. 287.64
Price to book value: 0.96
Price to Earning: 16.93
Profit growth 5Years: 26.95%
OPM 5Year: 15.78%
Operating profit: Rs. 2079.63Cr.
G Factor: 1.00
Piotroski score: 5.00
Earnings yield: 17.35%
EPS: Rs. 14.44

Pros:
- Stock is providing a good dividend yield of 4.09%.
- Stock is trading at 0.96 times its book value
- Company has been maintaining a healthy dividend payout of 40.41%
[ Read More ]

HINDUSTAN UNILEVER

HINDUSTAN UNILEVER

1.HINDUSTAN UNILEVER IS PROVIDING BOX TRADING OPPORTUNITY
2 Good support at 585-575 and resistance near 623 above that 644 .
3. 644 being good resistance one can sell with the sl of  651 
4. And can continue the same till it provide 


[ Read More ]

cox & king

                                                                 COX & KING

1 Possibility of triangle break out on RSI
2. Indicating some sort of accumulation
3.one can buy with the strict sl of 87.20 for the target of 95-98 for short term ( two to three week)
[ Read More ]

USD / INR

                                                     USD / INR


 1.Bulls may gain strength if USD / INR cross Rs 62.40 on closing basis
2 RSI on daily time frame is showing some sign of positive divergence
3Range for USD / INR  will be 62.40-60.40 .
4.It will gain more strength if it close above 62.40 and can test 65.20-66.70
5. Om the lover side it has good support at 58.60 , which has low probability.

[ Read More ]

Nifty update (spot level)

Daily updates


1. It was clearly visible that nifty was facing resistance at 6160-6140 , nifty again failed to sustain above 6120
2.we can also see valid trend line breakdown on RSI , which is now indicating weakness .
2.Nifty has taken support of Speed fan at 6080 level
3.Now important resistance level is 6120 and support is 6070 if it fails  to sustain  6070-6040 we can witness further weakness till 6005-5975 on next trading session .
4.So one  can sell nifty with the sl of 6125 on spot level for the target of 6040-6005-5980
5.It may gain some strength only if we close above 6145 .
[ Read More ]

Gold :- Overall bearish out look

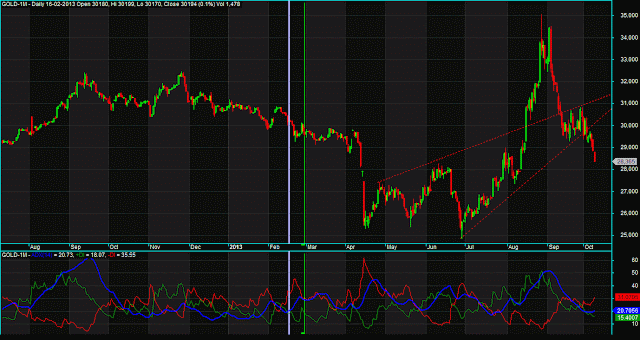
Gold :- Overall bearish out look


1.Gold has shown weakness in daily and weekly time frame
2.It will face resistance at 29780 and support at 27575.
3.Current  scenario  suggest to sell near 29200 and 29690 stop loss 29860 for the target of 27980-27640.

[ Read More ]

Reliance Infra heading towards 480


1.Reliance infra has come out of congestion area (rs 370)
2.it has given triangular break out at rs 386
3.stock has given substantial throw back at rs 375
4. Now it is heading towards rs 480 -510 it may consume 2 months to achieve the target
5.Currently stock is trading above short , medium and long moving averages

6. So One can bun on dip till 380-360 with sl at 351 for the target of 480-510 time period 2 months

note :- you can find updates on this stock if any under daily news letter link

[ Read More ]

    Subscribe via Email

    Site Stats